Construction Change Detection Using High-Resolution Satellite Imagery and Machine Learning
Introduction
Change detection using satellite imagery is a critical application of remote sensing that enables continuous monitoring of land cover and infrastructure dynamics over time. By analysing multi-temporal satellite data, it becomes possible to identify urban expansion, infrastructure development, deforestation, and other land-use transitions with high spatial accuracy.
This case study focuses on detecting construction-related changes within an unspecified region using high-resolution Beijing 3N3 (BJ3N3) satellite imagery acquired during two different time periods. By applying spectral index analysis and image differencing techniques, the objective was to identify areas that experienced construction activity between the two acquisition dates. The study demonstrates how geospatial analytics and semi-automated workflows can support urban monitoring and infrastructure assessment.
Data Description
The analysis was conducted using very high-resolution multispectral satellite data from the Beijing 3N3 (BJ3N3 – 21AT) satellite.
Satellite: Beijing 3N3 (BJ3N3 – 21AT)
Sensor Type: Optical, Multispectral
Spatial Resolution: 0.30 meters
Coordinate Reference System: EPSG:32639 – WGS 84 / UTM Zone 39N
Temporal Coverage: Two dates (Before and After the construction period)
Spectral Bands Used: Red, Green, Blue, Near Infrared (NIR)
The Beijing 3N3 sensor provides 30 cm spatial resolution, making it highly suitable for detailed urban feature extraction. This fine resolution enables precise identification of newly developed or modified built-up surfaces, including small-scale structures that are often missed by medium-resolution satellites.
Methodology
The workflow consisted of multiple preprocessing and analytical steps designed to extract meaningful construction-related change information from the satellite imagery.
Preprocessing
Image Registration: Both temporal images were geometrically aligned using the UTM Zone 39N projection to ensure pixel-level correspondence.
Radiometric Correction: Applied to minimise illumination differences and atmospheric variations between acquisition dates.
Cropping and Clipping: Study area boundaries were applied to both datasets to focus the analysis on the region of interest.
Change Detection Workflow
The change detection process was implemented using Python and standard geospatial libraries, following the steps below:
Import and Read Data
Both temporal datasets were loaded using libraries such asrasterio,numpy, andmatplotlib.Spectral Index Computation
Key spectral indices were calculated to enhance discrimination between built-up and non-built-up surfaces:Normalized Difference Built-up Index (NDBI)
Normalized Difference Vegetation Index (NDVI)
Image Differencing
Pixel-wise differencing was performed between the “After” and “Before” images (e.g.,NDBI_after – NDBI_before) to highlight surface reflectance changes associated with construction activity.Thresholding and Classification
The resulting difference map was thresholded and classified into:Positive Change: New construction or expansion
Negative Change: Demolition or vegetation replacement
No Change: Stable or unchanged surfaces
Visualization
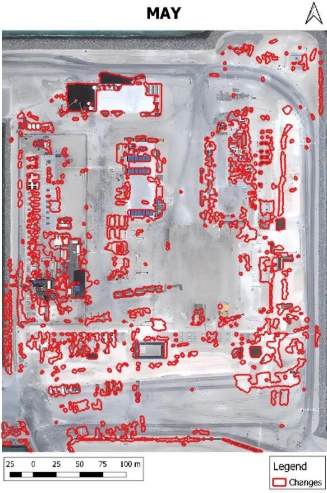
The final change map was visualized using a colour composite scheme:Red: New construction
Blue: Removed structures
Gray: No change
Implementation Summary
The implementation was carried out in a Python environment using Jupyter Notebook and exported as an interactive HTML file (Construction_change.html) for visual exploration.
Core Tools and Libraries Used:
Raster I/O: rasterio, GDAL
Computation: numpy, scipy
Visualization: matplotlib, folium
Data Management: GeoTIFF inputs with UTM-based spatial reference
A structured processing pipeline was developed to:
Align multi-temporal datasets
Compute NDVI and NDBI differences
Generate change masks
Export final classified change layers
Results
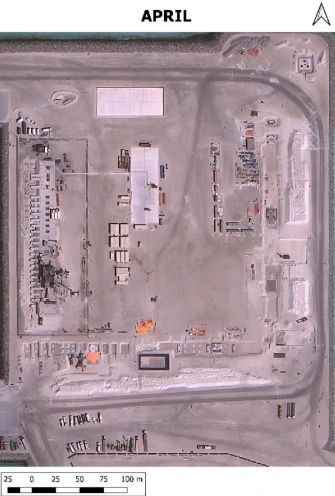
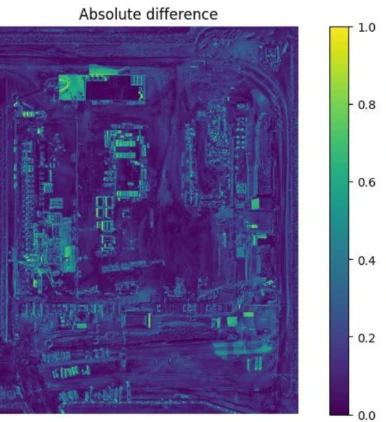
The absolute difference map revealed pixel-wise intensity variations between the April and May satellite images. Brighter areas indicated higher change intensity, corresponding to potential construction or surface modification activities.
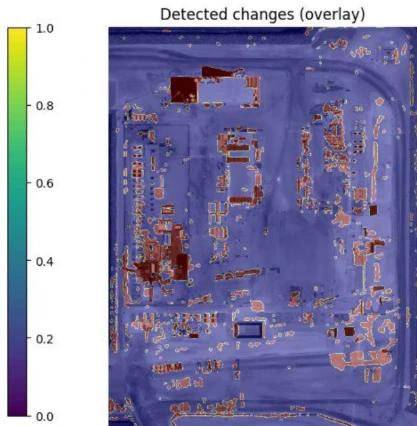
An overlay of the detected changes highlighted construction zones in red on top of the satellite imagery. These areas represented newly developed or altered construction features between the two acquisition dates.
Key observations include:
High positive difference values indicated new infrastructure such as buildings, roads, and urban extensions.
Negative difference values represented cleared or levelled areas.
Neutral values corresponded to unchanged terrain or natural vegetation.
The use of 30 cm resolution imagery enabled micro-level observation, allowing detection of small residential plots, narrow access roads, and minor construction activities. Visual inspection confirmed strong spatial correspondence between detected change polygons and actual construction features visible in the imagery.
Discussion
The use of very high-resolution Beijing 3N3 imagery provided a significant advantage for urban and construction monitoring. Compared to medium-resolution sensors such as Sentinel-2 or Landsat-8, the finer spatial detail greatly improved accuracy in identifying built-up changes.
Challenges Encountered:
Minor spectral differences between construction materials (e.g., concrete and bare soil) occasionally caused false positives.
Atmospheric variations between acquisition dates required additional normalization.
The absence of official construction boundary data limited quantitative validation.
Potential Improvements:
Integration of supervised machine learning or deep learning models (e.g., CNNs) for automated classification.
Use of multi-temporal datasets for long-term construction trend analysis.
Incorporation of shadow removal techniques and object-based image analysis to improve detection accuracy.
Conclusion
This case study demonstrates the effectiveness of high-resolution optical satellite imagery for detecting and mapping construction-related changes. The image differencing approach, supported by spectral index analysis, proved efficient in identifying new urban developments and structural modifications.
The methodology is scalable and can be applied across different regions for:
Urban growth monitoring
Infrastructure development tracking
Disaster damage and recovery assessment
High-resolution geospatial intelligence, combined with machine learning techniques, offers a powerful solution for accurate and timely construction activity monitoring.
Amit Thakur
GIS Engineer