Bivariate Remote Sensing for Structural and Chemical Crop Modeling.
Agriculture is currently undergoing a data-driven revolution. Remote sensing and satellite imagery have become the critical backbone of smart agriculture, transitioning traditional farming from generalized practices into a precision science. By capturing multi-wavelength surface reflectance and active radar backscatter, earth observation satellites enable the continuous monitoring of crop health at scale. These technologies empower agronomists and planners to optimize irrigation schedules, execute highly accurate yield predictions, and deploy targeted fertilizer applications. Ultimately, space-based insights allow the agricultural sector to maximize food production while simultaneously minimizing environmental impact and resource waste
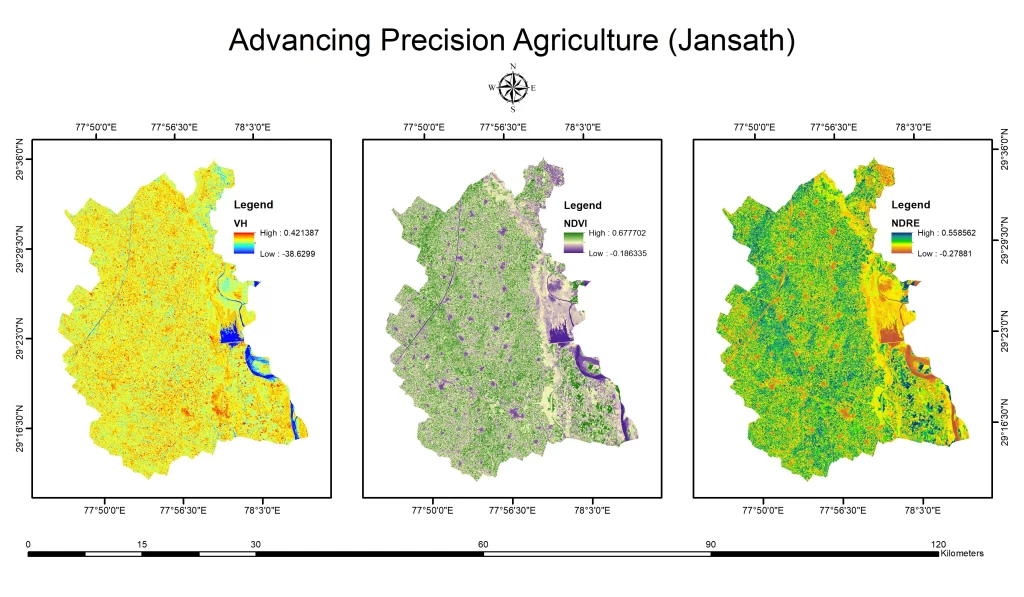
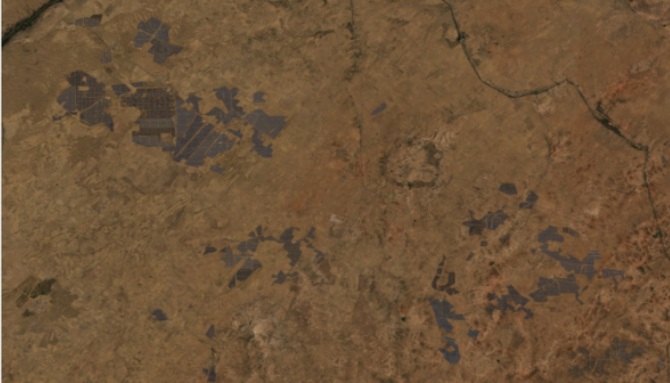
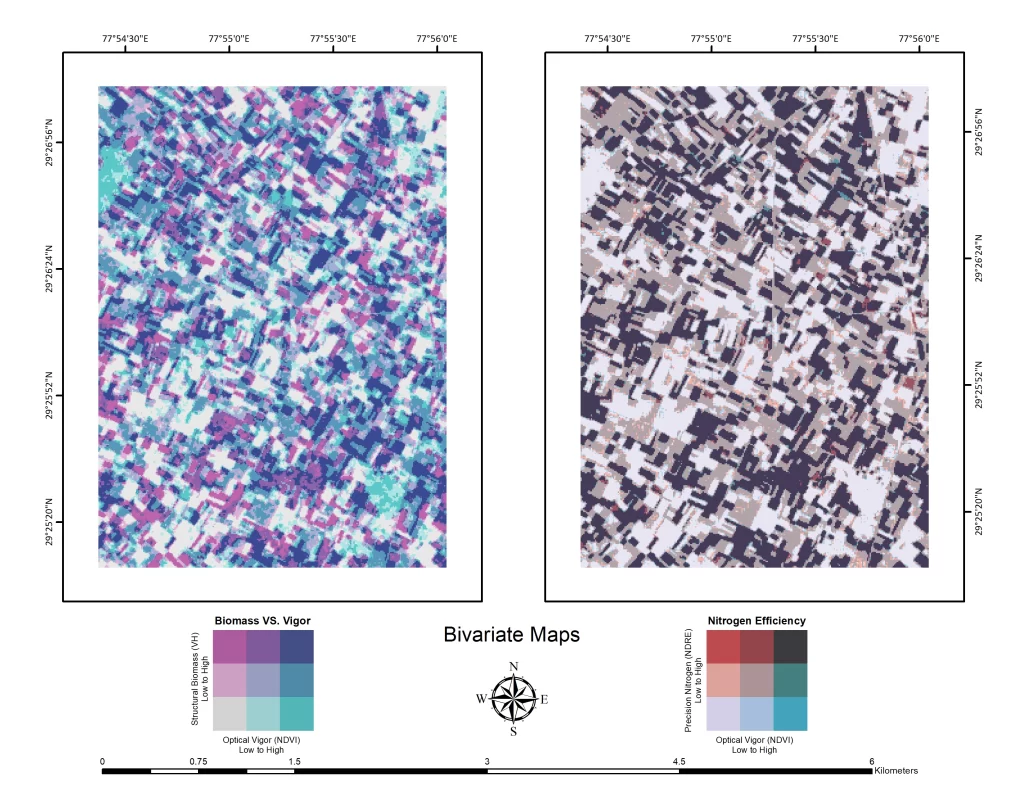
To demonstrate the practical power of these technologies, a recent case study conducted over the agricultural zones of Jansath, Muzaffarnagar, deployed an advanced dual-bivariate mapping technique. Rather than relying on single-variable maps-which often present an incomplete agronomic picture-this project mathematically fused structural biovolume with chemical vigor to create highly nuanced, nine-class cartographic matrices.
Data Integration and Methodology
The foundation of this analysis relied on the fusion of active and passive satellite payloads. Optical data was sourced from the Sentinel-2 multispectral instrument, utilizing Level-2A atmospherically corrected surface reflectance. This allowed for the precise calculation of two critical indices: the Normalized Difference Vegetation Index (NDVI) to establish baseline greenness, and the Narrow-Band Normalized Difference Red Edge (NDRE) to isolate localized chlorophyll and nitrogen concentrations.
Simultaneously, active Synthetic Aperture Radar (SAR) data from Sentinel-1 was processed through a rigorous radiometric and geometric pipeline. The Cross-Polarized (VH) backscatter was extracted to measure the physical, three-dimensional structural biomass of the canopy, providing a structural dataset completely unaffected by atmospheric haze or cloud cover.
To bridge these continuous data streams, the rasters were statistically broken down into discrete quantiles and spatially intersected using a base-10 matrix calculation. This methodology forced the data into clear, easily interpretable 3×3 classification grids.
Agronomic Interpretation and Field Benefits
The resulting bivariate deliverables provide an unprecedented level of field intelligence by diagnosing complex crop conditions that a standard NDVI map would miss.
Matrix 1: Structural Biomass vs. Optical Vigor (VH vs. NDVI)
This model separates true crop health from mere physical size. For instance, a field displaying high physical structure but low optical vigor immediately flags the presence of dry residue, woody overgrowth, or senescing crops. Conversely, high vigor paired with low structural volume serves as an early warning for dense, flat canopies that are at a severe risk of lodging (collapsing under their own weight).
Matrix 2: Precision Nitrogen Efficiency (NDRE vs. NDVI)
This matrix acts as a surgical chemical diagnostic tool. The model isolates a critical “Alert” zone where a canopy exhibits high overall vigor (NDVI) but abnormally low Red-Edge reflectance (NDRE). This specific signature indicates severe nitrogen starvation or leaching that is being masked by dense foliage. By pinpointing these exact coordinates, farmers can transition from blanket-spraying to variable-rate fertilizer application, deploying nitrogen exactly where it is deficient and saving significant chemical costs.
Scaling with SATPALDA
While public-access Sentinel data provides a highly robust regional baseline at a 10-meter resolution, scaling these precision insights down to the micro-plot or individual farm level requires a leap in spatial fidelity. This is where SATPALDA Geospatial Services bridges the critical gap between regional monitoring and hyper-local farm management.
By leveraging SATPALDA’s extensive portfolio of high-resolution and very-high-resolution (VHR) commercial satellite imagery, agribusinesses and government planning agencies can execute this exact bivariate methodology at the sub-meter level. Commercial multispectral tasking allows for the extraction of ultra-precise micro-chemical variations, while high-resolution stereoscopic data can generate flawless digital canopy height models that public satellites simply cannot match. Through advanced data processing and dedicated commercial satellite tasking, SATPALDA transforms raw orbital data into actionable, field-level agronomic intelligence, directly driving the future of sustainable, high-yield agriculture.
Himansh Ameta
GIS Intern