SAR-Driven Flood Assessment in Nepal
Using SAR and optical imagery to assess river-channel change and infrastructure exposure
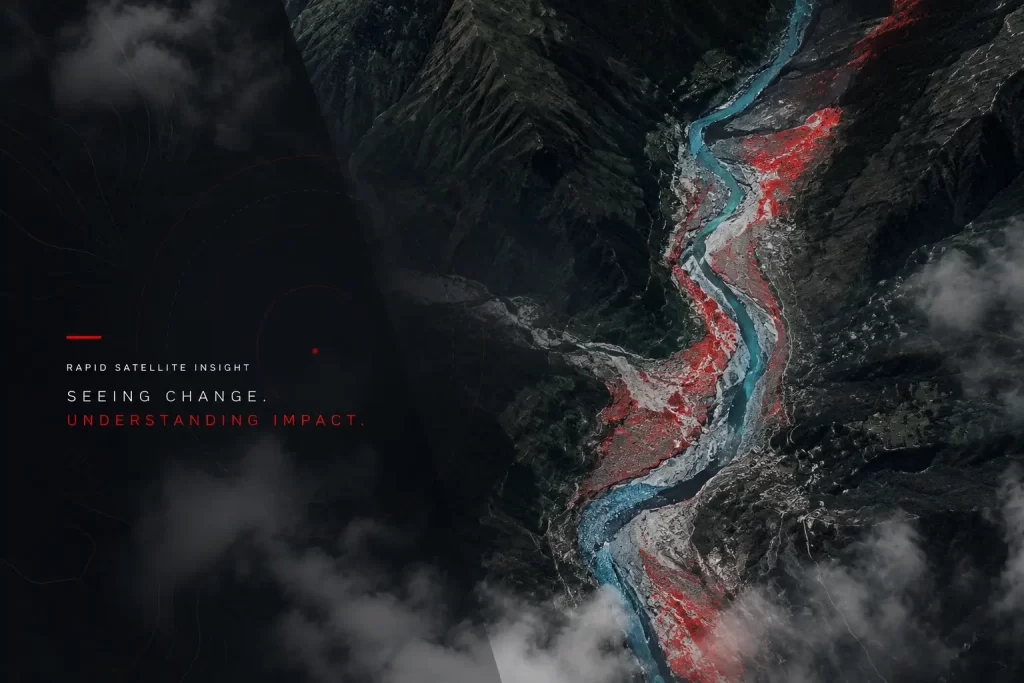
Assessing Flood and Debris Impact in a Himalayan River Valley
Floods in steep Himalayan valleys can rapidly transform river channels, erode banks and redistribute large volumes of sediment and debris. In August 2026, a rapid satellite-based assessment was carried out in a flood- and debris-affected river corridor in Nepal to identify surface changes and understand their implications for nearby infrastructure.
With cloud limiting optical observations, Synthetic Aperture Radar (SAR) was used as the primary change-detection source, while high-resolution optical imagery was used to validate and interpret the detected changes.
Why SAR Was Critical?
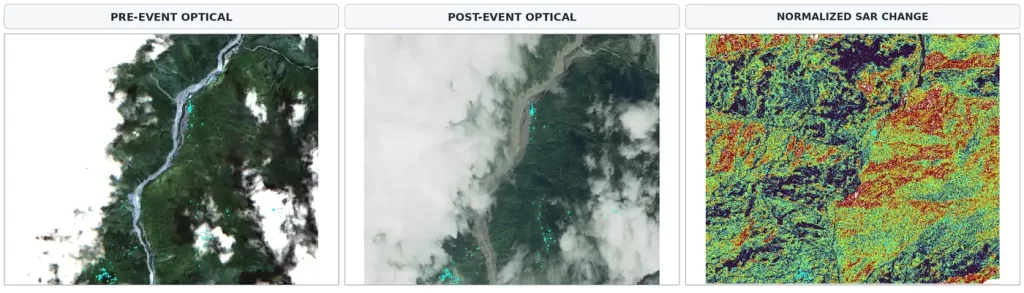
Cloud cover interrupted optical observations across parts of the valley, making continuous visual assessment difficult. SAR provided a spatially continuous record of surface change despite the cloud, making it the primary layer for identifying affected areas. Optical imagery was then used selectively to confirm what the radar signal represented on the ground.
visual assessment difficult during a rapidly evolving
flood event.
spatially continuous observations of the affected corridor for rapid change assessment.
SAR-First, Optical-Validated
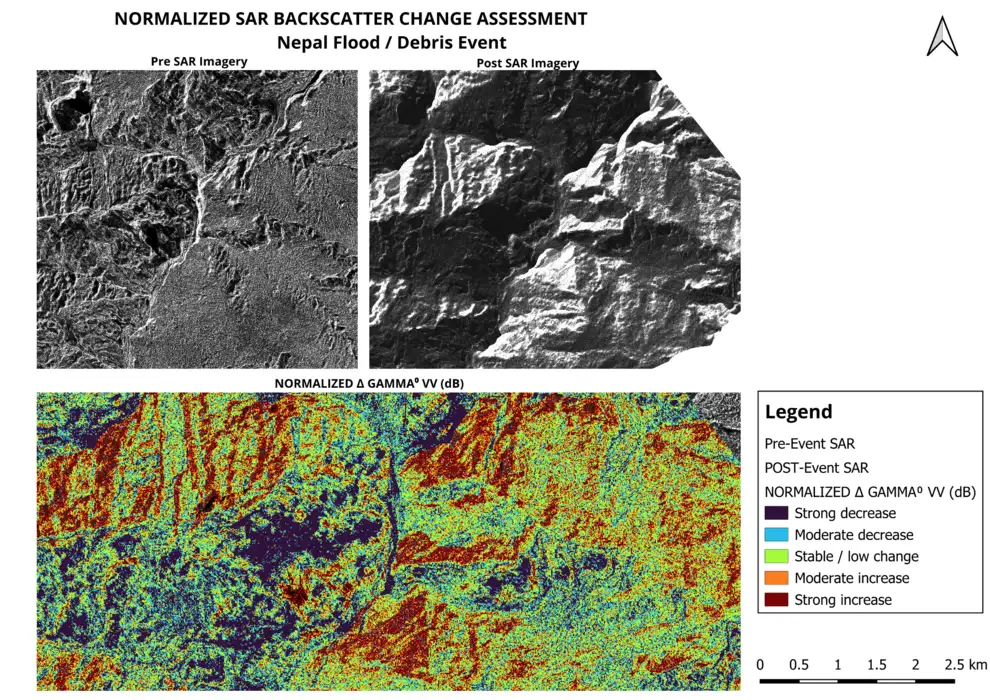
Pre- and post-event X-band VV SAR imagery were compared on a common 5 m analysis grid. The resulting normalized backscatter-change image was used to identify areas of significant surface change. High-resolution optical imagery was subsequently used to validate and interpret those changes.
PRE-EVENT SAR
Establishes the reference radar backscatter before the event.
POST-EVENT SAR
Captures radar observations after the event for comparison.
SAR CHANGE DETECTION
Highlights spatially coherent changes in radar backscatter.
OPTICAL VALIDATION
Provides visible surface detail to validate and interpret the detected change.
Satellite Data
What Did the SAR Analysis Reveal?
The normalized SAR change image reveals a pronounced and spatially coherent zone of surface change along the affected valley corridor. Both positive and negative backscatter responses are present, reflecting different surface conditions associated with wet or scoured areas, rough debris and other physical changes.
From Radar Signal to Physical Change
Optical imagery was used as an independent check of the SAR-detected changes. Where the ground was visible, strong radar responses corresponded with clear evidence of river-channel expansion and surface reworking.
Evidence from Four Representative Sites
Four representative locations were examined to understand how the radar-detected changes translated into physical impacts along the river corridor.
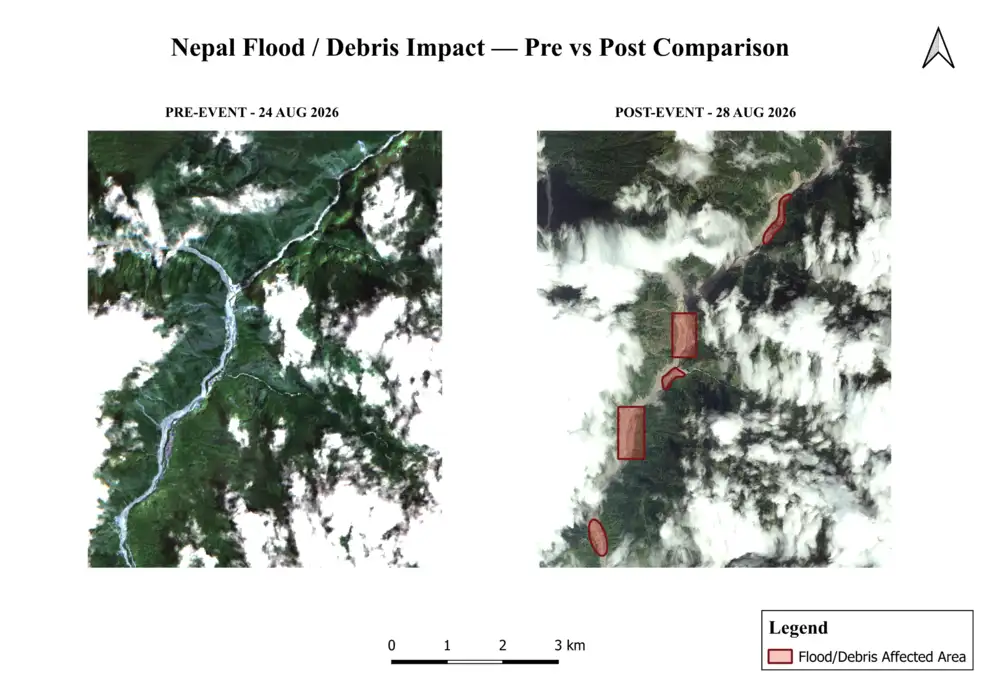
Site 1: Channel Widening
The post-event river corridor is visibly wider, with fresh sediment extending beyond the previous active channel toward nearby developed areas.
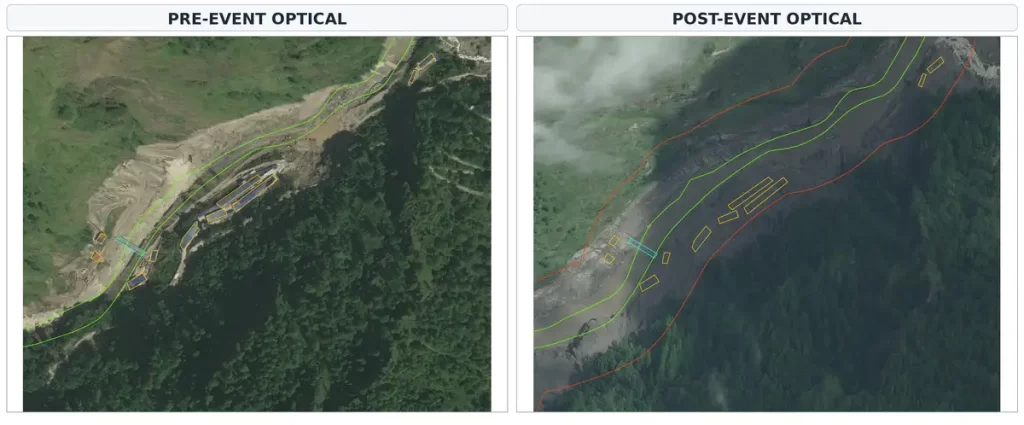
Site 2: Major Lateral Expansion & Debris
Site 2 shows substantial expansion of the disturbed corridor, with debris covering a much larger part of the valley floor and extending around previously developed areas.
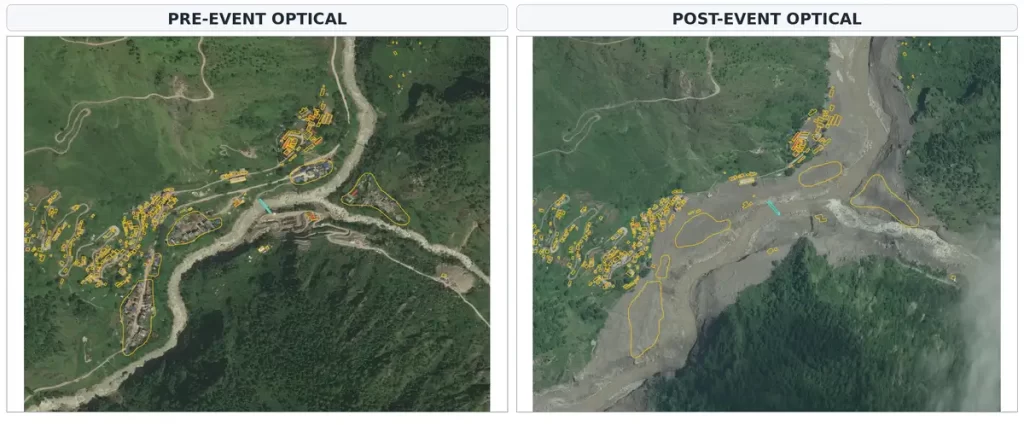
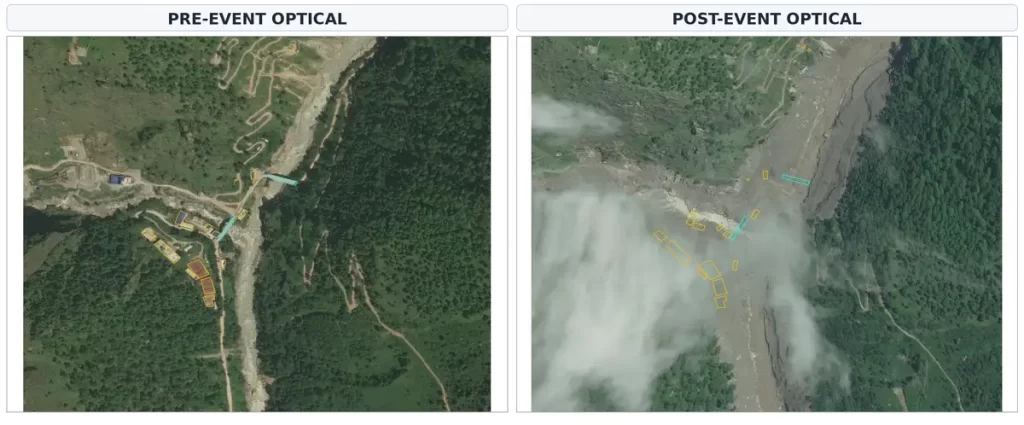
Site 3: Debris Burial & Infrastructure Exposure
Fresh sediment dominates the post-event surface, with several previously visible building footprints becoming less clearly expressed. The bridge provides a fixed reference for assessing the local change.
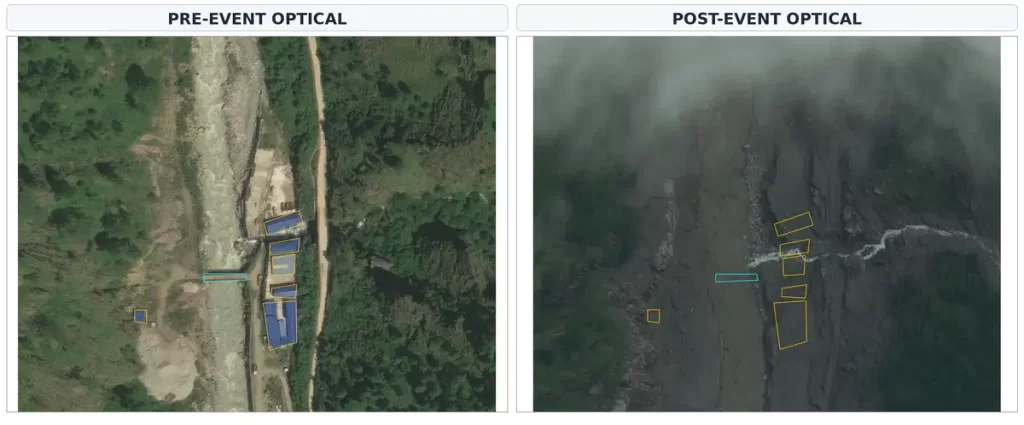
Site 4: River-Adjacent Infrastructure
Widespread fresh sediment and surface disturbance are visible around structures located immediately beside the river. Several mapped building footprints fall within or directly beside the reworked corridor.
What the Assessment Shows
- River Channel Change:
The river corridor expanded laterally beyond the pre-event channel in multiple locations. - Debris & Sediment Redistribution:
Fresh sediment and debris reworked substantial areas of the valley floor. - Infrastructure Exposure:
Buildings and bridges were located within or immediately beside areas affected by channel and surface reworking.
- River Channel Change:
Surface Change ≠ Structural Damage
The SAR result identifies surface change, not structural damage. Building and bridge overlays indicate exposure and do not confirm whether individual structures were destroyed, damaged, or remain functional.
Why Combine SAR and Optical Imagery?
SAR + Optical provide complementary evidence for detecting, validating, and interpreting surface change.
Together, the two sensor types provide a more defensible assessment than relying on either source alone.
Limitations
- Differences in SAR viewing geometry can introduce terrain-related backscatter changes.
- Cloud cover limits optical validation in some areas.
- Infrastructure overlays indicate exposure, not structural damage.
- Field observations were not available in the supplied assessment material.
Conclusion
The SAR-first assessment identified a coherent zone of pronounced surface change along the affected river corridor in Nepal. Optical imagery confirmed channel widening, erosion, fresh sediment and debris deposition at representative sites, with buildings and bridges exposed to the enlarged corridor. The case study demonstrates how SAR can provide continuous change detection in cloud-prone mountain environments, while optical imagery adds essential ground-level interpretation and validation.
Mandeep Choudhary
Senior GIS Engineer