Detect Every Change That Matters with Satellite Imagery
Discover how change detection helps monitor infrastructure, land use, environmental changes, and more.
Every Change Tells a Story. Are You Seeing It?
From expanding cities and infrastructure projects to environmental shifts and land-use changes, change detection using satellite imagery provides the insights needed to monitor progress, identify risks, and make informed decisions. Through the application of high-precision Earth observation technologies, we can isolate and quantify both subtle and massive transformations across the globe.
What is Change Detection?
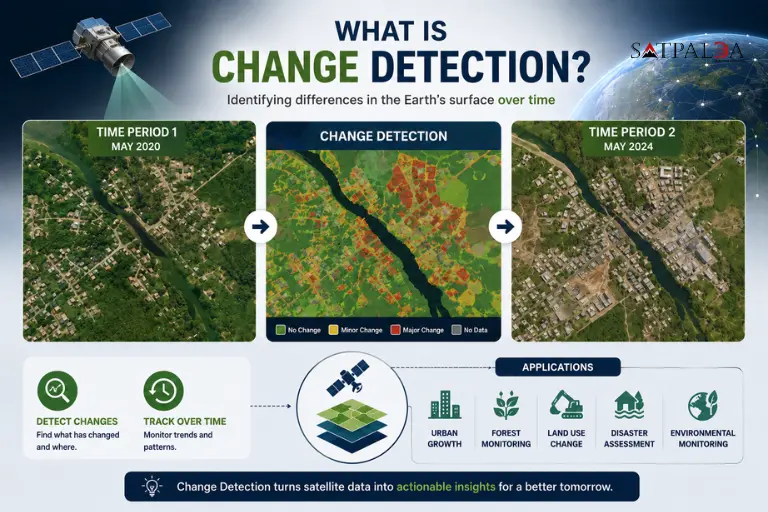
Change detection is the analytical process of comparing spatial datasets – specifically satellite imagery – captured at disparate temporal intervals to identify and analyze permutations on the Earth’s surface. It enables organizations, through rigorous geospatial intelligence and GIS consulting methodologies, to monitor developments, assess impacts, and respond proactively using accurate, up-to-date geospatial data. Whether tracking urban expansion, monitoring construction progress, or assessing environmental changes, change detection transforms raw optical imagery and multispectral data into actionable intelligence. decisions. Through the application of high-precision Earth observation technologies, we can isolate and quantify both subtle and massive transformations across the globe.
A Rigorous Algorithmic Approach to Delineating Change
Change detection is the analytical process of comparing spatial datasets – specifically satellite imagery – captured at disparate temporal intervals to identify and analyze permutations on the Earth’s surface. It enables organizations, through rigorous geospatial intelligence and GIS consulting methodologies, to monitor developments, assess impacts, and respond proactively using accurate, up-to-date geospatial data. Whether tracking urban expansion, monitoring construction progress, or assessing environmental changes, change detection transforms raw optical imagery and multispectral data into actionable intelligence. decisions. Through the application of high-precision Earth observation technologies, we can isolate and quantify both subtle and massive transformations across the globe.
NDVI Derivation :-
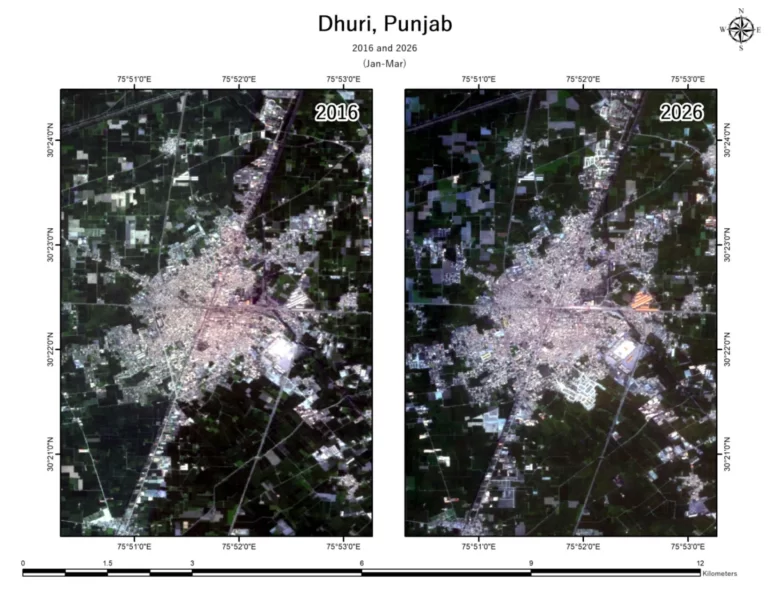
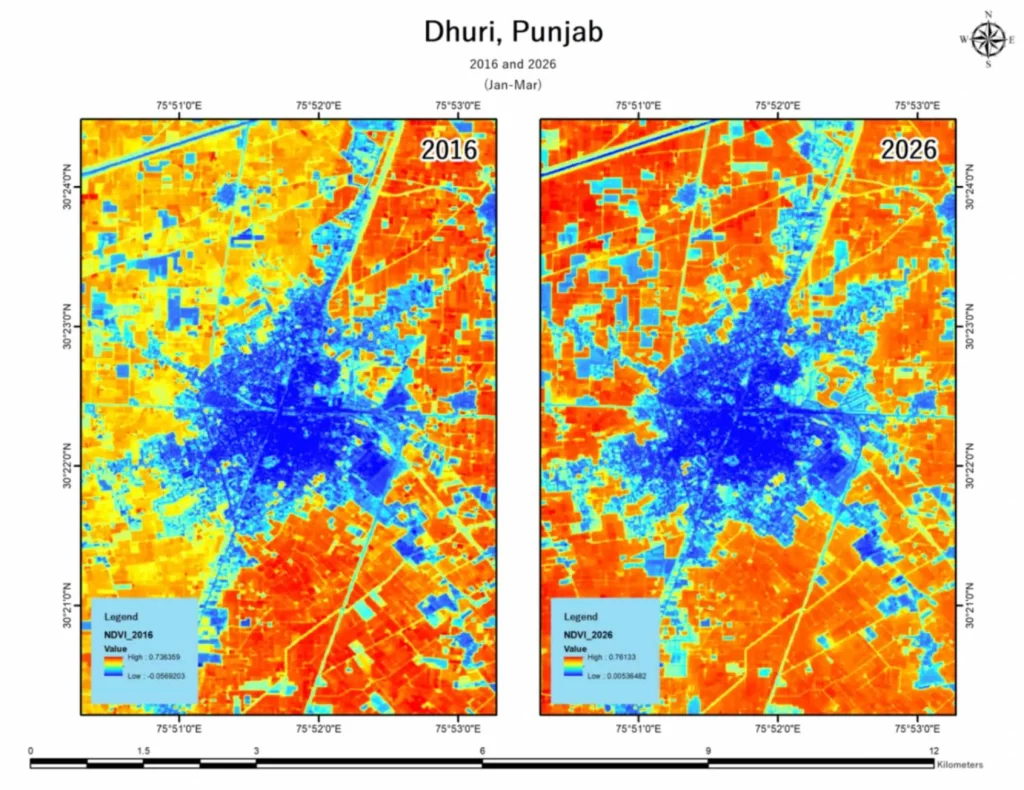
The Normalized Difference Vegetation Index (NDVI) was computed for both datasets to quantify vegetative vigor. As observed in NDVI maps and corroborated by the True Color Composites, the central urban core consistently registers lower NDVI values, while the surrounding agricultural matrix exhibits high vegetative reflectance.
Unsupervised Machine Learning :-
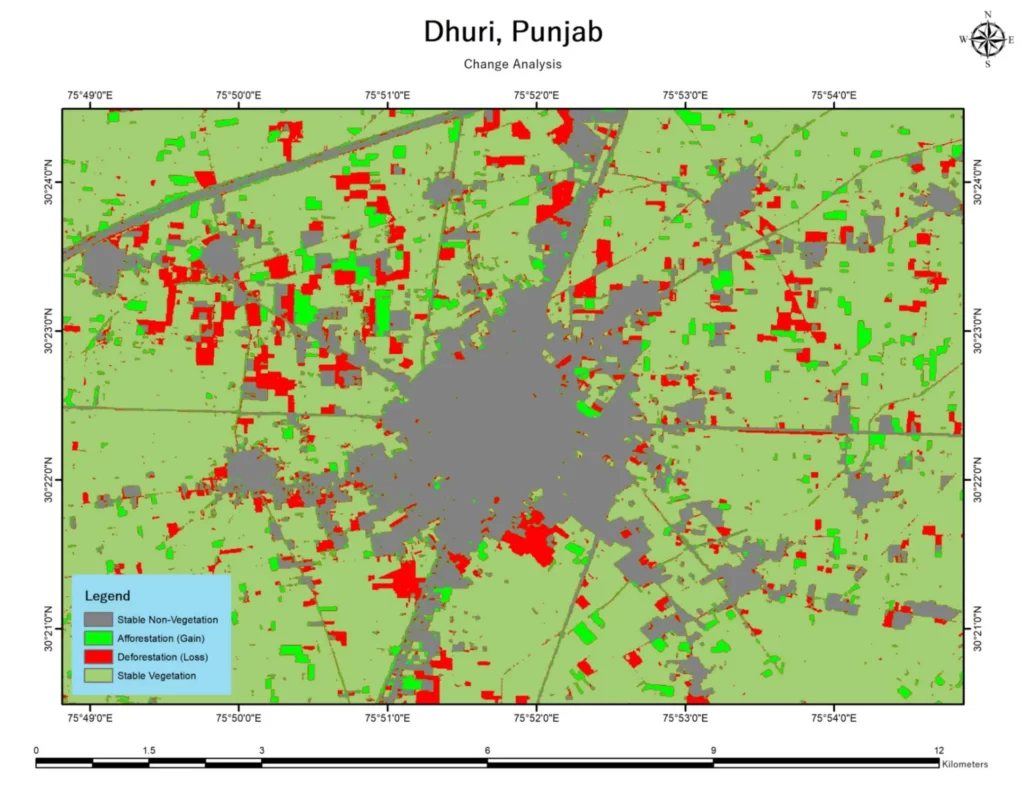
We applied K-Means Clustering directly to the NDVI histograms to bifurcate the data into discrete binary classifications. The algorithm autonomously authenticates the cluster centroids, strictly mandating that the higher NDVI cluster is unequivocally classified as Vegetation (1) and the lower as Non-Vegetation (0). This mathematical constraint prevents any risk of random class inversion during the clustering process.
Spatial Intersection Strategy :-
By intersecting the binary outputs from the 2016 and 2026 datasets, we generated a definitive matrix of change. This isolates specific pixels into distinct categories: stable vegetation (light green), stable non-vegetation (gray), afforestation/gain (bright green), and deforestation/loss (red).
This intersection strategy is exceptionally versatile; beyond vegetation dynamics, it serves as a foundational analytical tool for encroachment detection, water body depletion, and large-scale construction monitoring.
WHY IT MATTERS?
Where Change Detection Makes an Impact?
Infrastructure Monitoring:
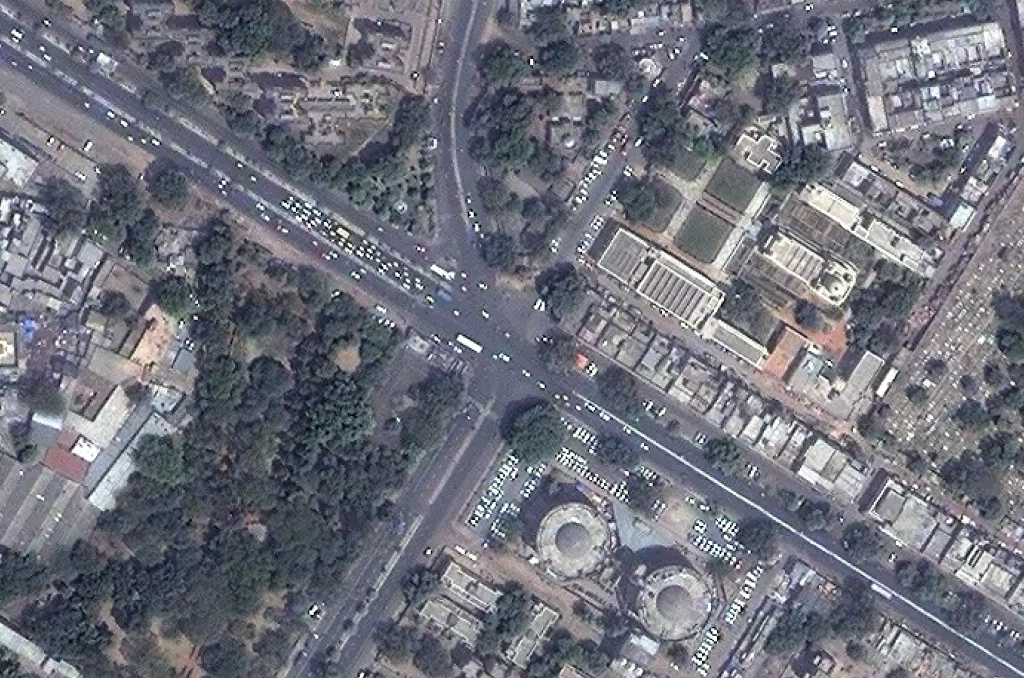
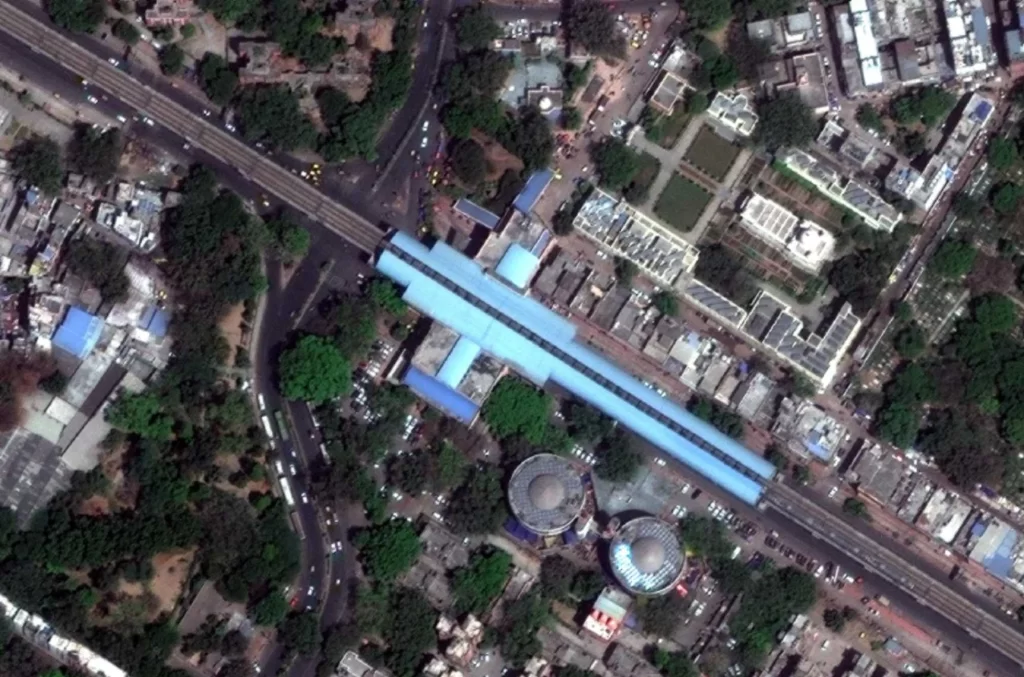
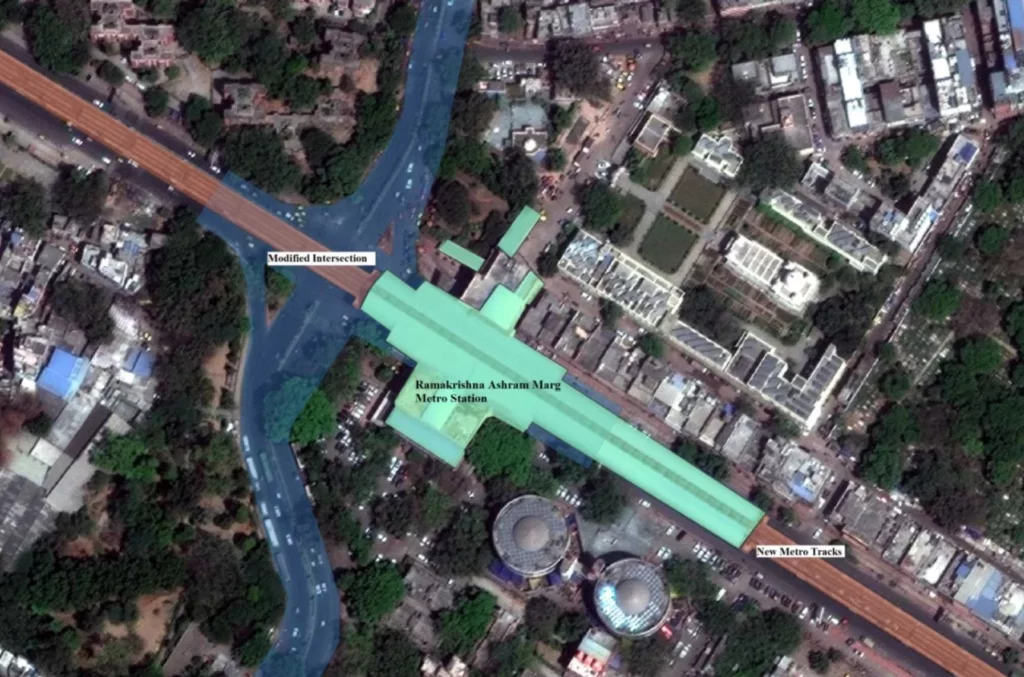
Track construction progress, road development, and large-scale infrastructure projects. High-resolution satellite imagery provides an unparalleled vantage point for observing the evolution of complex engineering feats and monitoring site evolution. A prime example is the visual chronicle of the Ramakrishna Ashram Marg intersection in Delhi. Aerial imagery from 2002 reveals a standard, unencumbered urban intersection. Fast forward to the 2022 dataset, and the landscape is fundamentally transformed. The annotated metro clearly delineates this transformation, highlighting the modified intersection of the roads (blue), the massive architectural footprint of the newly constructed Ramakrishna Ashram Marg Metro Station (green) superimposed over the junction, and the alignment of the new elevated metro tracks (orange). This capability empowers project managers to conduct remote construction monitoring and logistical assessments with remarkable precision.
Environmental Monitoring:
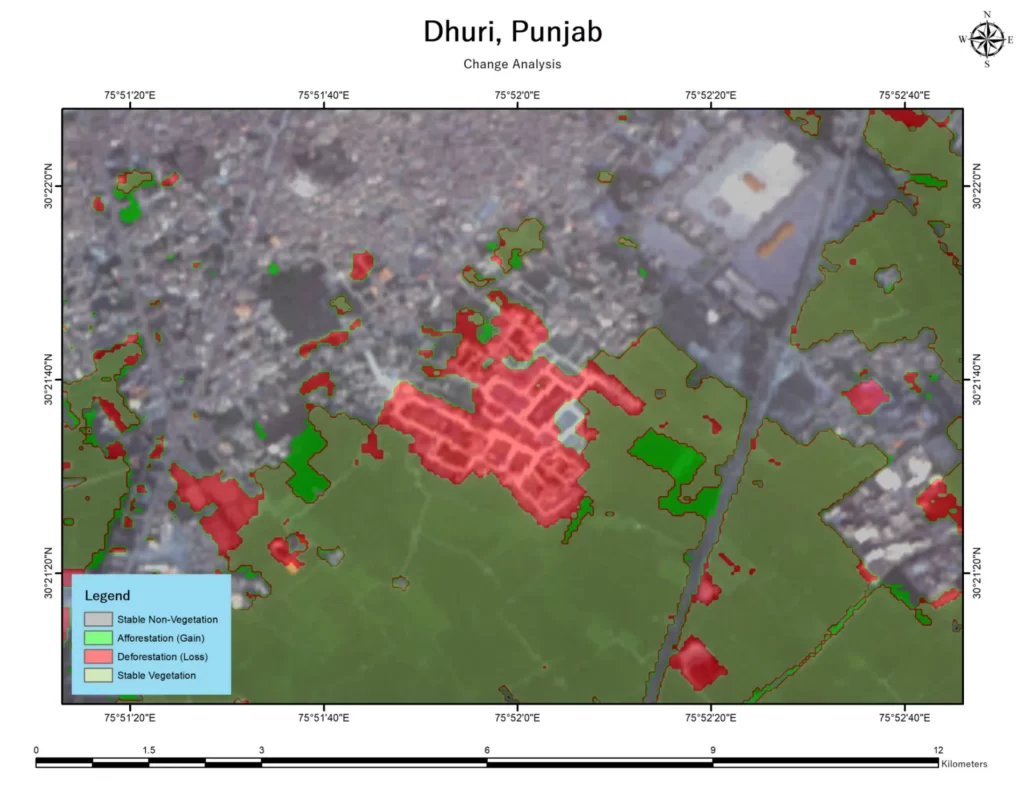
Assess deforestation, vegetation loss, waterbody changes, and ecosystem health. By utilizing optical imagery alongside specialized indices, we map the shifting boundaries of our natural resources, providing vital data for environmental stakeholders and the AGROTECH sector. The Dhuri analysis explicitly maps areas of stable vegetation against critical zones of deforestation. When looking at the high-resolution overlay in the zoomed in map, we can pinpoint exact micro-level changes where vegetative cover has been compromised, offering empirical data crucial for nutrient management and sustainable land-use planning.
Urban Development:
Monitor land-use changes, city expansion, and unauthorized developments. The transition from agricultural land to built-up urban environments is vividly captured in the spatial data. In the Dhuri analysis, the expansion of the stable non-vegetation (gray) zones outward into previously vegetated areas (red loss zones) perfectly delineates the footprint of urban sprawl. This intelligence allows municipal authorities to track unauthorized encroachments, optimize city planning, and map the spatial distribution of industrial clusters.
Mining & Industrial Operations:
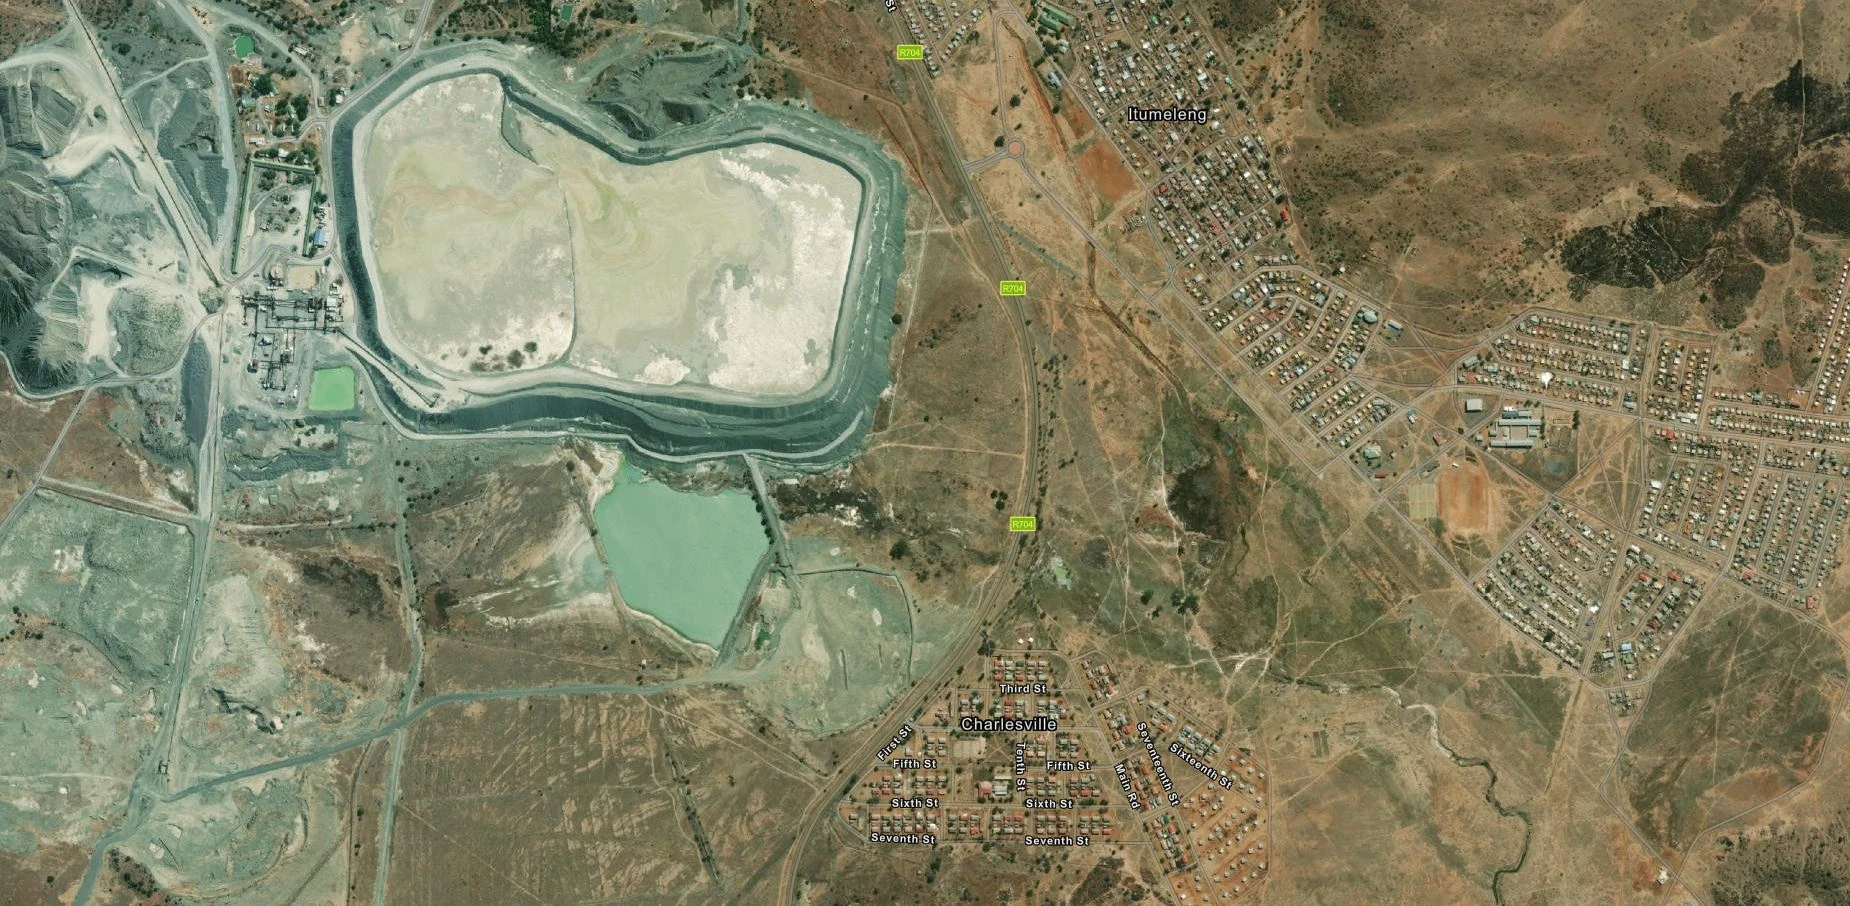
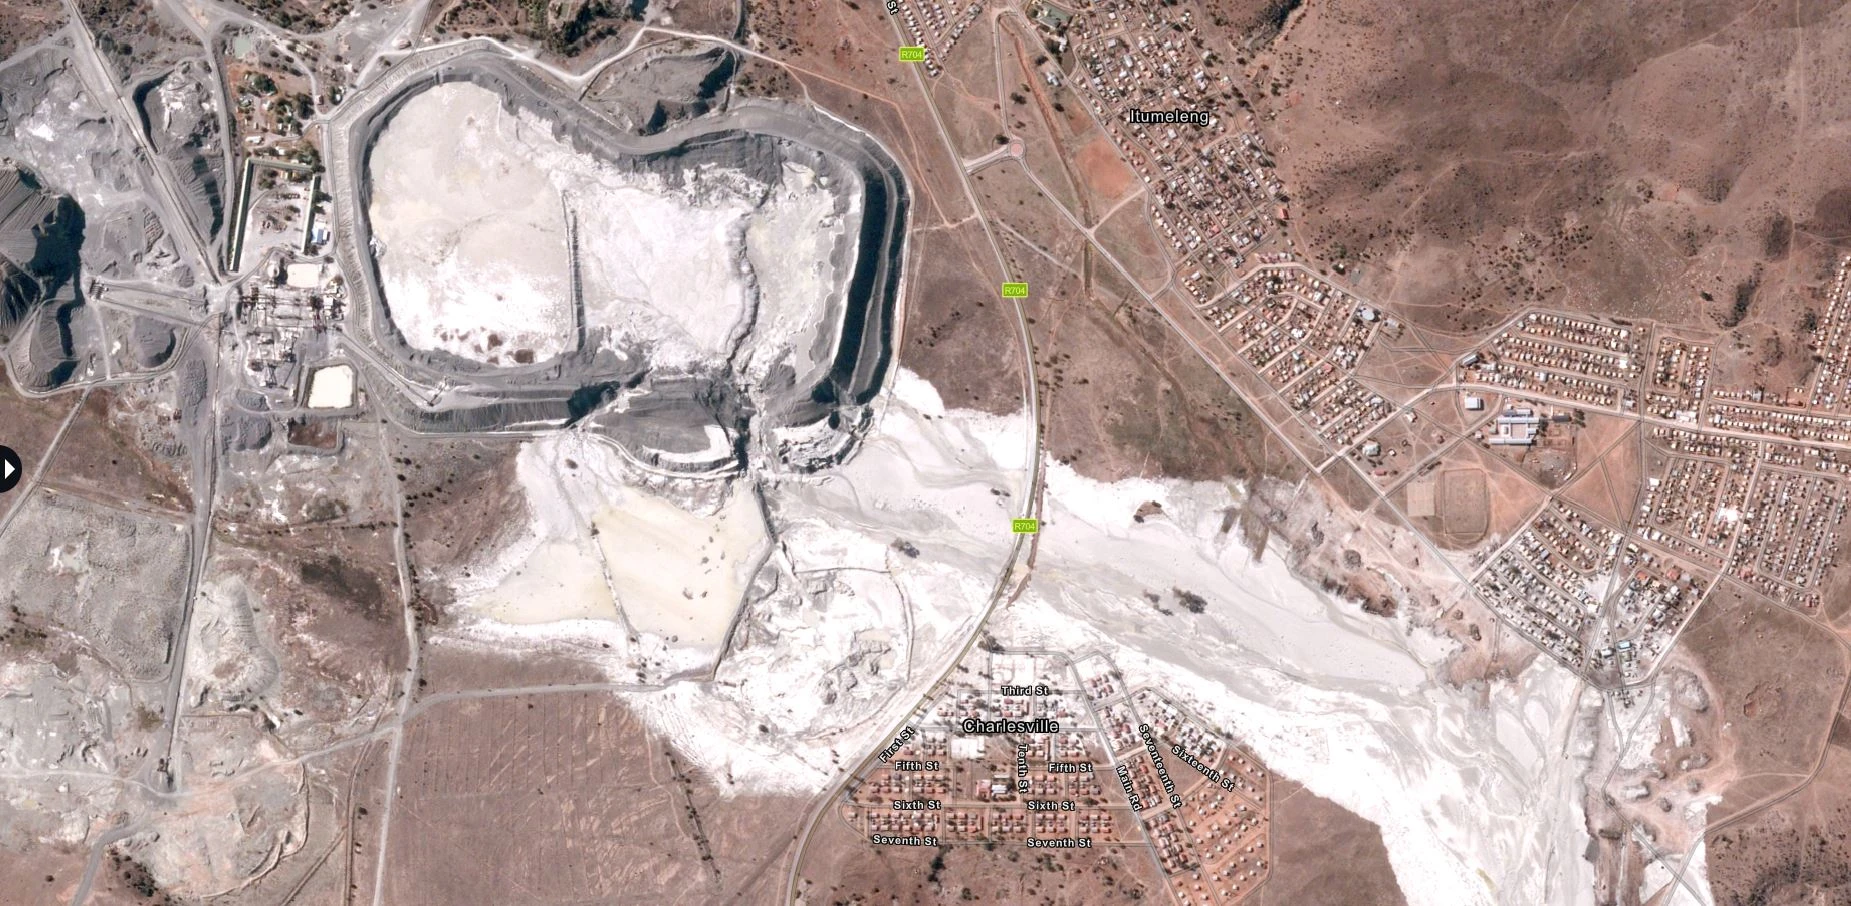
Observe site expansion, operational activity, and terrain changes over time. The same rigorous intersection methodology applied to urban and agricultural zones is critical for the extractive industries. High-precision Earth observation – often augmented by Synthetic Aperture Radar (SAR) and hyperspectral data – empowers analysts to monitor the expansion of exploration zones, verify regulatory compliance, and detect illegal mining activities. Whether analyzing soil fertility variability and mineral prospectivity zones, or tracking the footprint of local industrial quarries, satellite-derived change detection remains the ultimate tool for strategic resource planning.
Conclusion
Change is constant—but understanding it requires the right perspective. Satellite imagery combined with advanced change detection techniques transforms years of Earth observation data into clear, actionable insights that support smarter planning and faster decision-making. From monitoring infrastructure development and urban expansion to assessing environmental changes and industrial operations, change detection provides a reliable, data-driven view of how landscapes evolve over time.
At Satpalda, we combine high-resolution satellite imagery, GIS expertise, and advanced analytical workflows to deliver accurate, objective, and scalable change detection solutions tailored to your requirements. Whether you need to monitor a single project or analyze changes across vast regions, our geospatial intelligence helps you detect every change that matters with confidence.
Himansh Ameta
GIS Intern
FAQs
The accuracy of satellite change detection depends on the satellite's spatial resolution, image quality, temporal frequency, and the analytical methods used. High-resolution imagery combined with advanced GIS and remote sensing techniques can detect changes with high precision.
Satellite Imagery Update frequency depends on the satellite constellation. Some satellites revisit the same location daily, while others provide imagery every 5–16 days, enabling regular monitoring of ongoing changes.
Yes. By comparing satellite images from different dates, change detection can identify unauthorized construction, land encroachment, and land-use changes, helping authorities monitor compliance and enforce regulations.
Image classification categorizes land features such as vegetation, water, and built-up areas in a single image, while change detection compares two or more images captured at different times to identify and measure changes.
Satellite Imagery covers large areas quickly, enables frequent monitoring, reduces field survey costs, provides historical data for comparison, and allows remote access to locations that are difficult or unsafe to reach.