Rooftop Solar Mapping Using VANTOR Precision 3D Bundle | True Ortho, DSM & 3D Mesh
1. Introduction
The increasing demand for renewable energy has led to the adoption of rooftop solar photovoltaic systems in urban environments. Accurate identification of suitable rooftops is essential for efficient solar panel installation. High-resolution geospatial datasets enable detailed rooftop analysis, including shadow detection, roof geometry analysis, and solar radiation estimation.
This project evaluates rooftop solar potential using the VANTOR’s Precision 3D Bundle dataset consisting of high-resolution 50cm True Ortho imagery, 50cm Digital Surface Model (DSM), and 50cm 3D Mesh data. The study analyses rooftop geometry, obstruction features, shadow impact, solar radiation availability throughout the day, and estimates the usable rooftop area for solar panel installation.
2. Data Used
2.1 VANTOR Precision 3D Bundle Datasets
The analysis uses the following datasets from the VANTOR Precision 3D Bundle:
| Dataset | Resolution | Purpose |
|---|---|---|
True Ortho Imagery | 50 cm | Rooftop feature identification and visual validation |
Digital Surface Model
(DSM) | 50 cm | Height information for buildings and obstacles |
3D Mesh | 50 cm | Detailed rooftop geometry visualization |
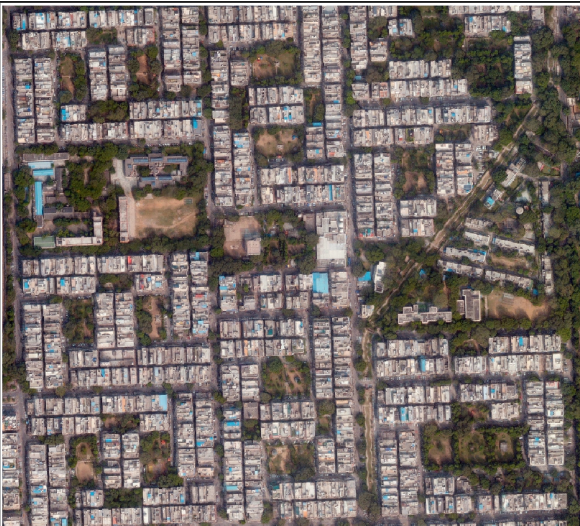
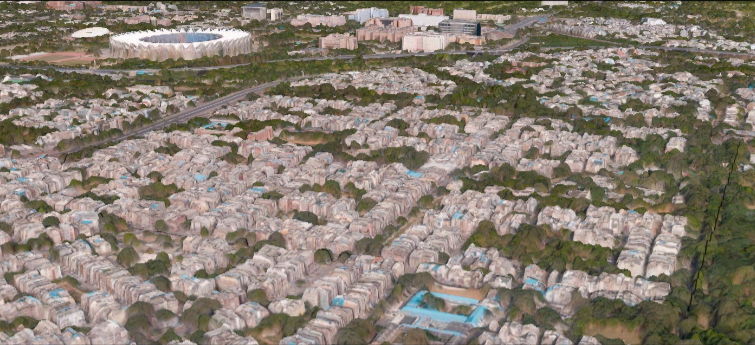
True Ortho Imagery
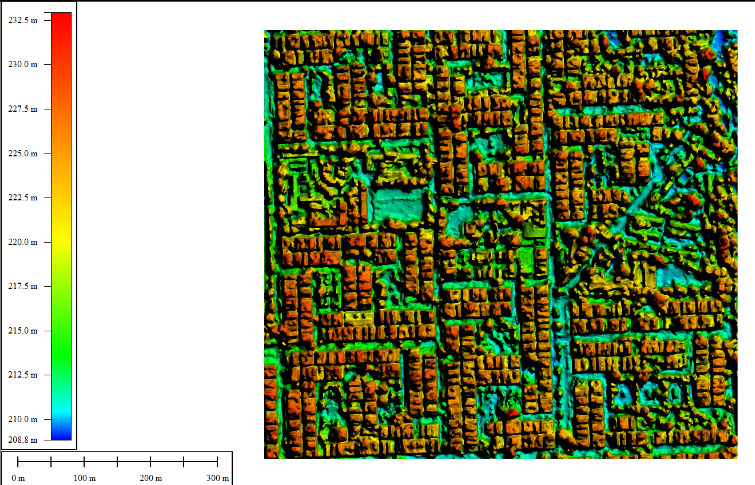
Digital Surface Model (DSM)
3D Mesh
3. Methodology
The methodology consists of several steps to estimate rooftop solar potential.
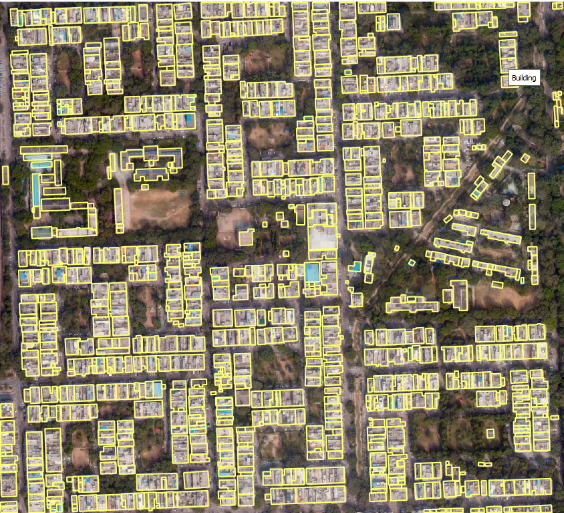
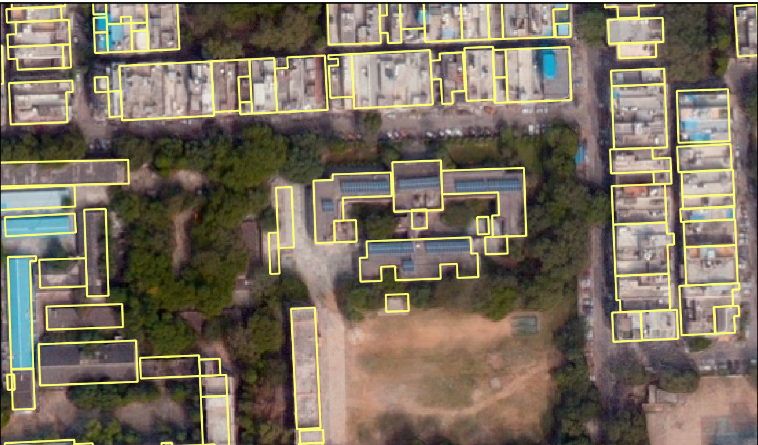
3.1 Building Rooftop Feature Extraction
Using high-resolution True Ortho imagery and DSM data, rooftop features were extracted. These include:
- Building footprint
- Water tanks
- Existing Solar Panel
- Pipelines
- HVAC
- Staircase rooms
- Chimneys
- Parapet walls
These features are important as they reduce the usable rooftop area for solar panel
installation.
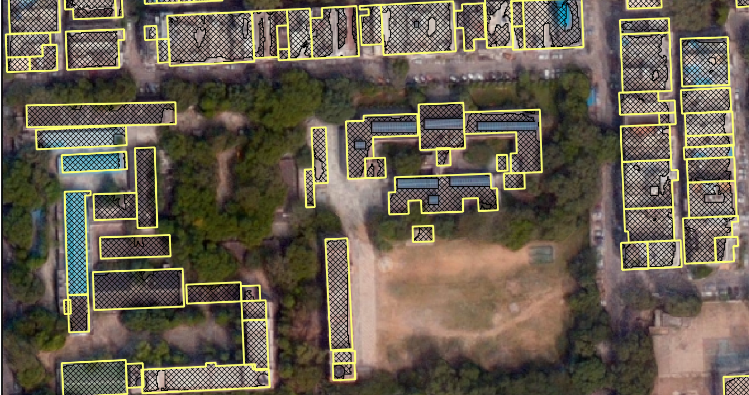
3.2 Shadow Analysis
Shadow analysis was carried out to evaluate the impact of surrounding buildings, rooftop structures, and other elevated objects on the availability of solar radiation on rooftops. Shadows play a critical role in rooftop solar potential assessment because shaded areas receive significantly lower solar energy and are therefore less suitable for solar panel installation. The analysis was performed using the Digital Surface Model (DSM) derived from the VANTOR’s Precision 3DBundle with a spatial resolution of 50 cm. The DSM represents the height of all surface features such as buildings, and rooftop structures, which allows accurate simulation of shadow patterns.
Shadow simulations were generated using the Hillshade algorithm, which models illumination conditions based on the position of the sun. The hillshade tool requires two key parameters:
- Sun Azimuth – the horizontal direction of the sun measured in degrees from north.
- Sun Altitude – the vertical angle of the sun above the horizon
By changing these parameters, shadows can be simulated for different times of the day.
To understand how shadows affect rooftop solar exposure throughout the day, three hillshade simulations were generated representing morning, noon, and evening solar positions.
Morning Shadow Simulation
The morning shadow simulation represents the sun position during the early part of the day when the sun is at a lower altitude. During this period, shadows are typically longer and extend across larger rooftop areas due to the low sun angle.
This simulation helps identify rooftops that may remain shaded during the morning hours, particularly in dense urban environments where tall buildings block sunlight.
Noon Shadow Simulation
The noon simulation represents the time when the sun reaches its highest position in the sky. At this time, shadows are significantly shorter because the sun altitude is highest.
This condition provides the maximum solar exposure on rooftops and represents the most favourable period for solar energy generation.
Evening Shadow Simulation
The evening simulation represents the later part of the day when the sun begins to descend toward the horizon. Similar to morning conditions, the lower sun altitude causes shadows to extend across rooftops again.
This simulation helps identify rooftops that experience shading during the afternoon and evening hours due to nearby structures.
Darker areas represent regions affected by shadow, while brighter areas indicate surfaces receiving direct sunlight. The analysis illustrates how shadow length and direction change throughout the day due to variations in the sun’s position.
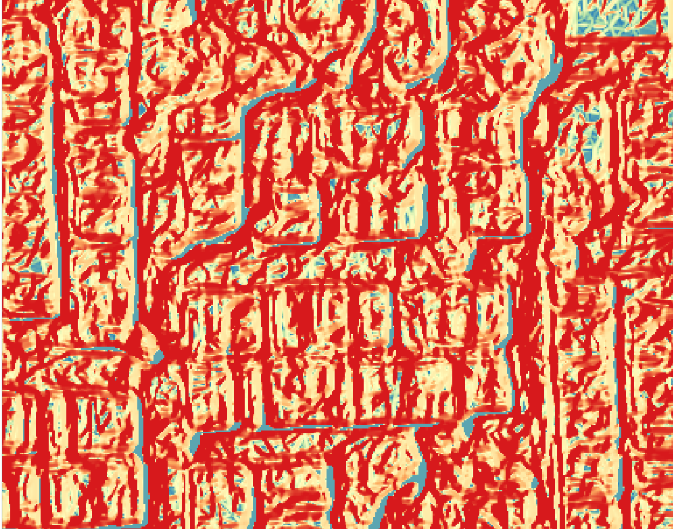
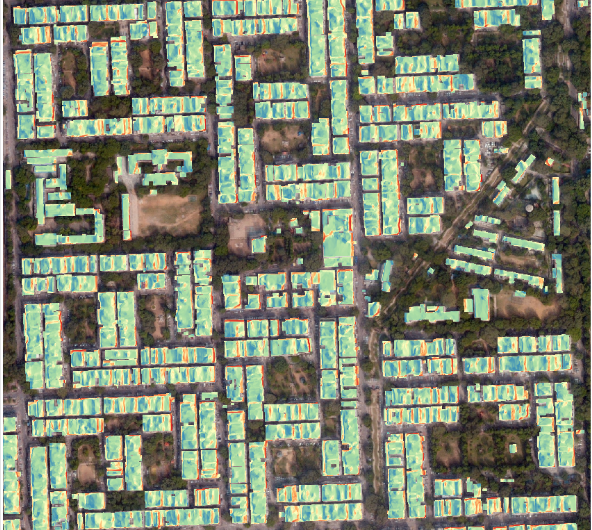
3.3 Solar Radiation Analysis
Solar radiation analysis was conducted to estimate the amount of solar energy received on rooftops throughout the day. The sun angle changes from morning to evening, which affects the amount of radiation reaching each rooftop surface.
The output of the analysis is a solar radiation raster layer representing the total solar energy received per unit area. The values are expressed in:
Wh/m²/day (Watt-hours per square meter per day)
This unit represents the amount of solar energy received by one square meter of surface area during a single day. Higher radiation values indicate areas that receive greater solar energy and are therefore more suitable for solar photovoltaic panel installation. Conversely, areas with lower radiation values generally correspond to locations affected by shading from nearby buildings and rooftop structures.
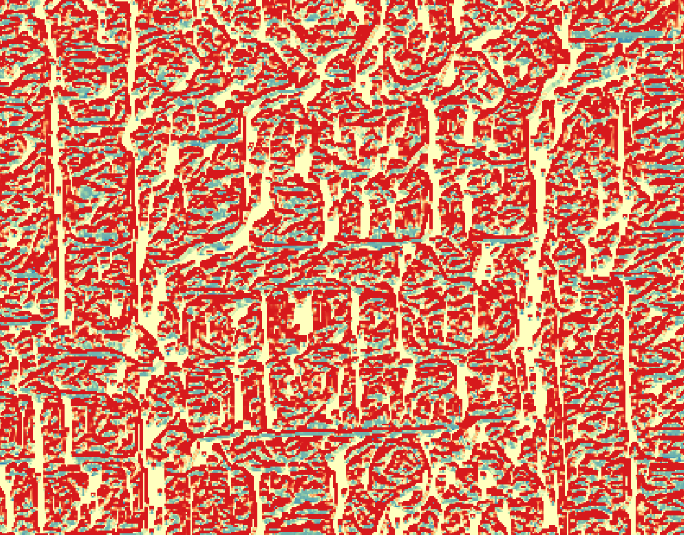
The solar radiation layer was further clipped using the building footprint layer to estimate solar energy specifically over rooftop surfaces. This step allows identification of rooftops with higher solar potential and helps determine the most suitable areas for installing solar panels.
The results of this analysis provide a spatial distribution of solar energy availability across rooftops within the study area, which is essential for estimating solar installation capacity and identifying optimal locations for rooftop solar systems.
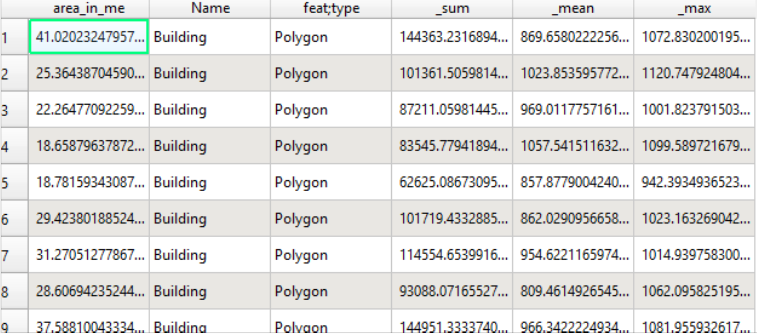
Further statistical analysis was then performed on the clipped rooftop radiation layer to quantify solar potential. The following statistical parameters were calculated for each rooftop:
- Sum of solar radiation – Represents the total solar energy received across
the rooftop surface. - Mean solar radiation – Indicates the average solar energy received per
square meter of rooftop area. - Maximum solar radiation – Identifies the locations on rooftops receiving the
highest solar exposure.
3.4 Roof Area Calculation
The total rooftop area of each building was calculated using the building footprint
layer. This represents the maximum available space for solar panel installation before considering obstacles.
- Total area of Building footprint: 178762 m 2
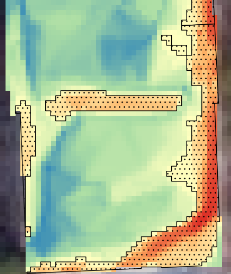
3.5 Usable Rooftop Area Estimation
Not all rooftop space can be used for solar panels due to the presence of obstacles. After removing all obstructions, the remaining area was classified as the usable rooftop area.
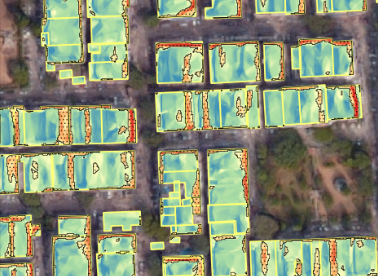
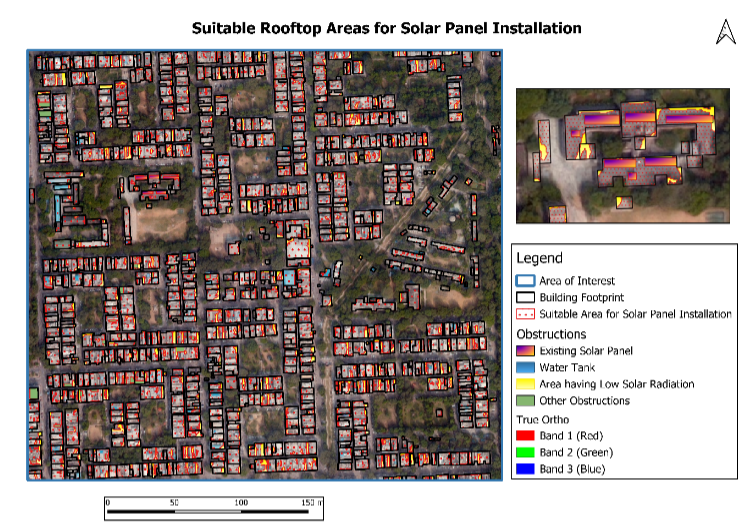
4. Final Map of Potential Rooftop Solar Installation Area
A final potential rooftop solar installation map was generated by integrating the results from rooftop feature extraction, shadow analysis, and solar radiation assessment. The purpose of this map is to identify rooftop areas that are suitable for
installing solar photovoltaic (PV) panels.
5. Solar Panel Capacity Estimation
The number of solar panels that can be installed on a rooftop is estimated using the available rooftop area.
Average Solar Panel Size
A standard solar panel typically has an area of approximately: 1.7 m² per panel
Panel Estimation Formula:
For the study area:
Building rooftop area = 178762 m²
Usable rooftop area = 148455 m²
Therefore approximately 87326 solar panels can be installed on the rooftop.
6. Cost of Solar Installation
Approximate installation cost in India:
1 kW ₹45,000 –₹60,000
3 kW ₹1.3 – ₹1.8 Lakhs
5 kW ₹2 – ₹3 Lakhs
Actual cost may vary depending on panel type and installation conditions.
7. Government Subsidy
Government of India provides subsidies under the Rooftop Solar Programme.
Typical subsidy structure:
Up to 3 kW ~40% subsidy
3–10 kW ~20% subsidy
These subsidies significantly reduce the cost of rooftop solar installations.
8. Conclusion
This study demonstrates the use of high-resolution geospatial datasets from the VANTOR’s Precision 3DBundle for rooftop solar potential assessment. Using DSM-based shadow analysis and solar radiation modeling, suitable rooftop areas for solar installation can be accurately identified. The integration of rooftop geometry, obstruction detection, and solar radiation estimation provides a reliable framework for urban solar energy planning. The results can support city planners, energy agencies, and homeowners in adopting rooftop solar systems and promoting sustainable energy solutions.
9. Future Scope
Future improvements can include:
- Annual solar radiation modeling
- Automated rooftop obstacle detection
- Integration with electricity demand data
- City-scale solar potential mapping
Amit Thakur
GIS Engineer